Version Analytics:
Turn Every Release
Into a Success Story
Track installations, compare bug rates, and measure stability across versions to ensure every update is more reliable than the last.
Why Use Version Analytics?
Every app exists to help users complete goals — signups, purchases, logins, uploads, and checkouts. But when bugs or performance issues interrupt these journeys, users drop off, conversions fall, and revenue gets impacted.
Real-time Monitoring
Instantly see how quality changes with every release.
Version Comparison
Spot trends and regressions across all app versions.
Actionable Insights
Get clear, prioritized recommendations for improvement.
Easy Integration
Seamlessly add QS to your workflow and dashboards.
Understanding Version Analytics
GFI measures how bugs and performance issues prevent users from completing critical goals like signups, purchases, and checkouts — helping teams connect technical friction directly to business impact.
Identify Critical Issues
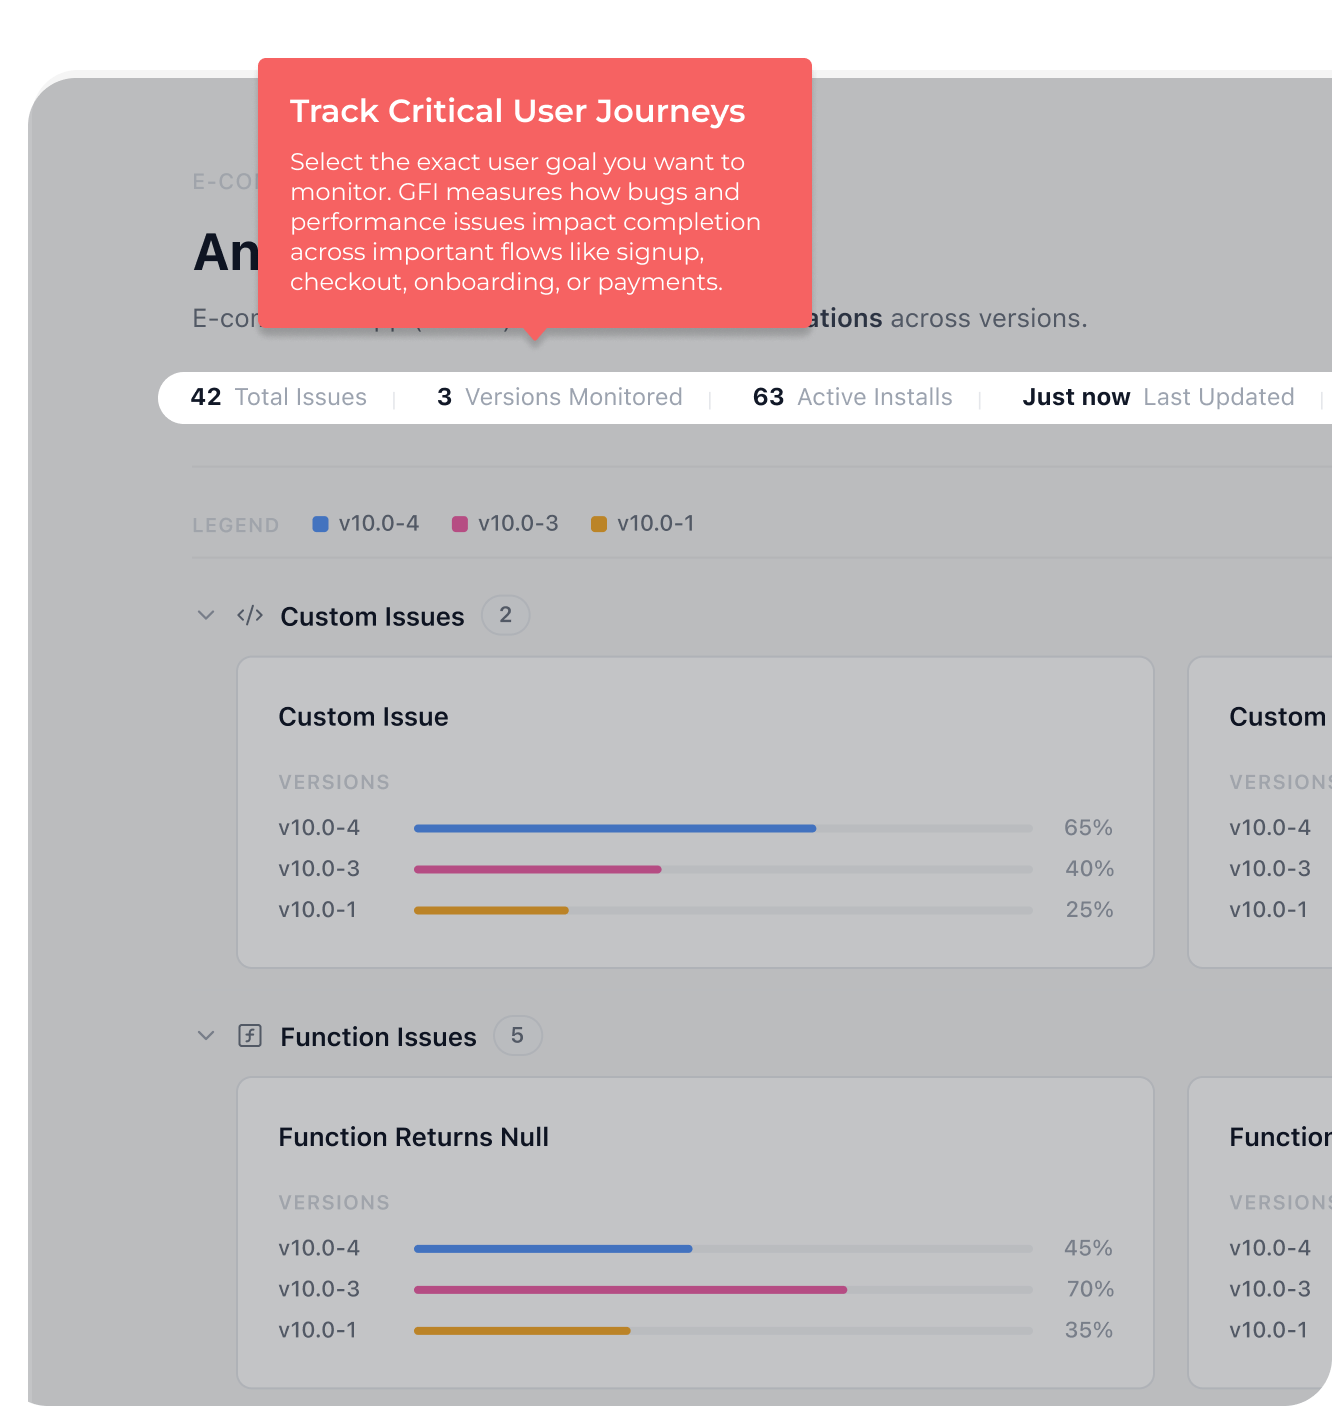
Define the critical user journey you want to measure — from signups and onboarding to purchases, uploads, or custom business goals. GFI starts by tracking the flows that matter most to your users and revenue.
Weighted Average
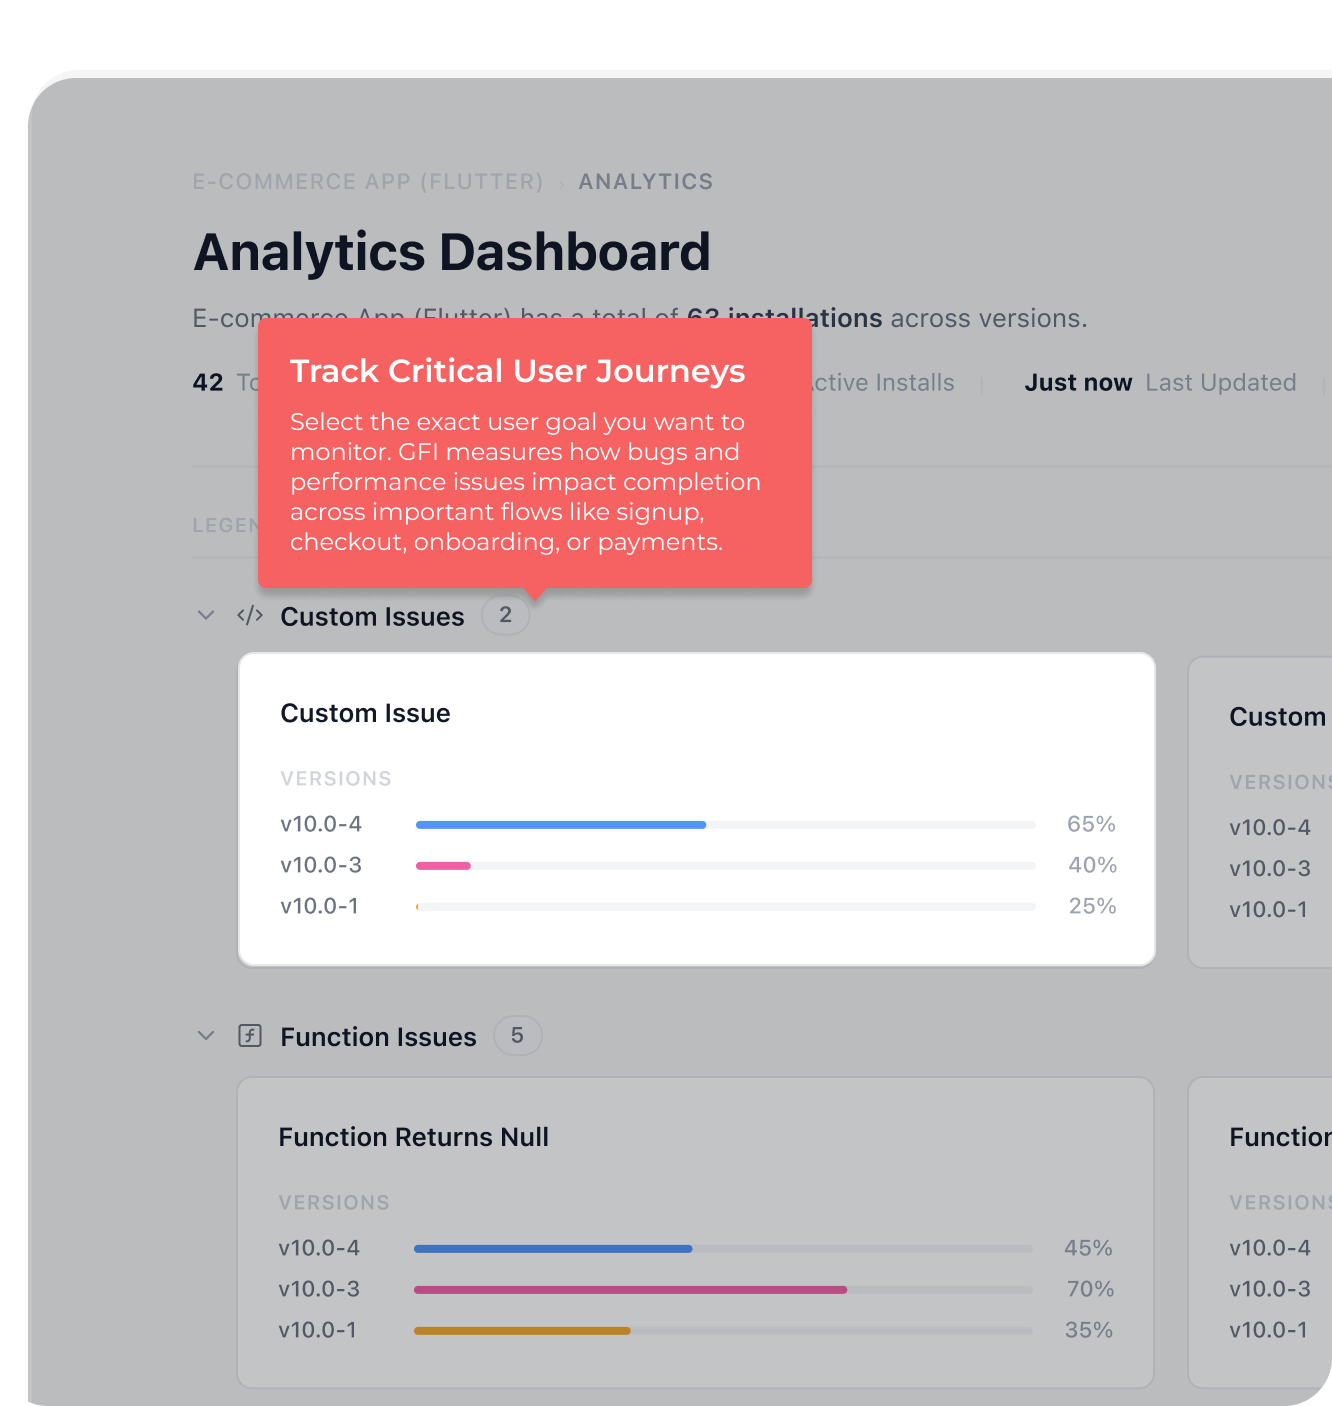
Understand how friction changes across app versions by connecting installation data with GFI scores. Quickly identify which releases are creating the highest user disruption and drop-off risk.
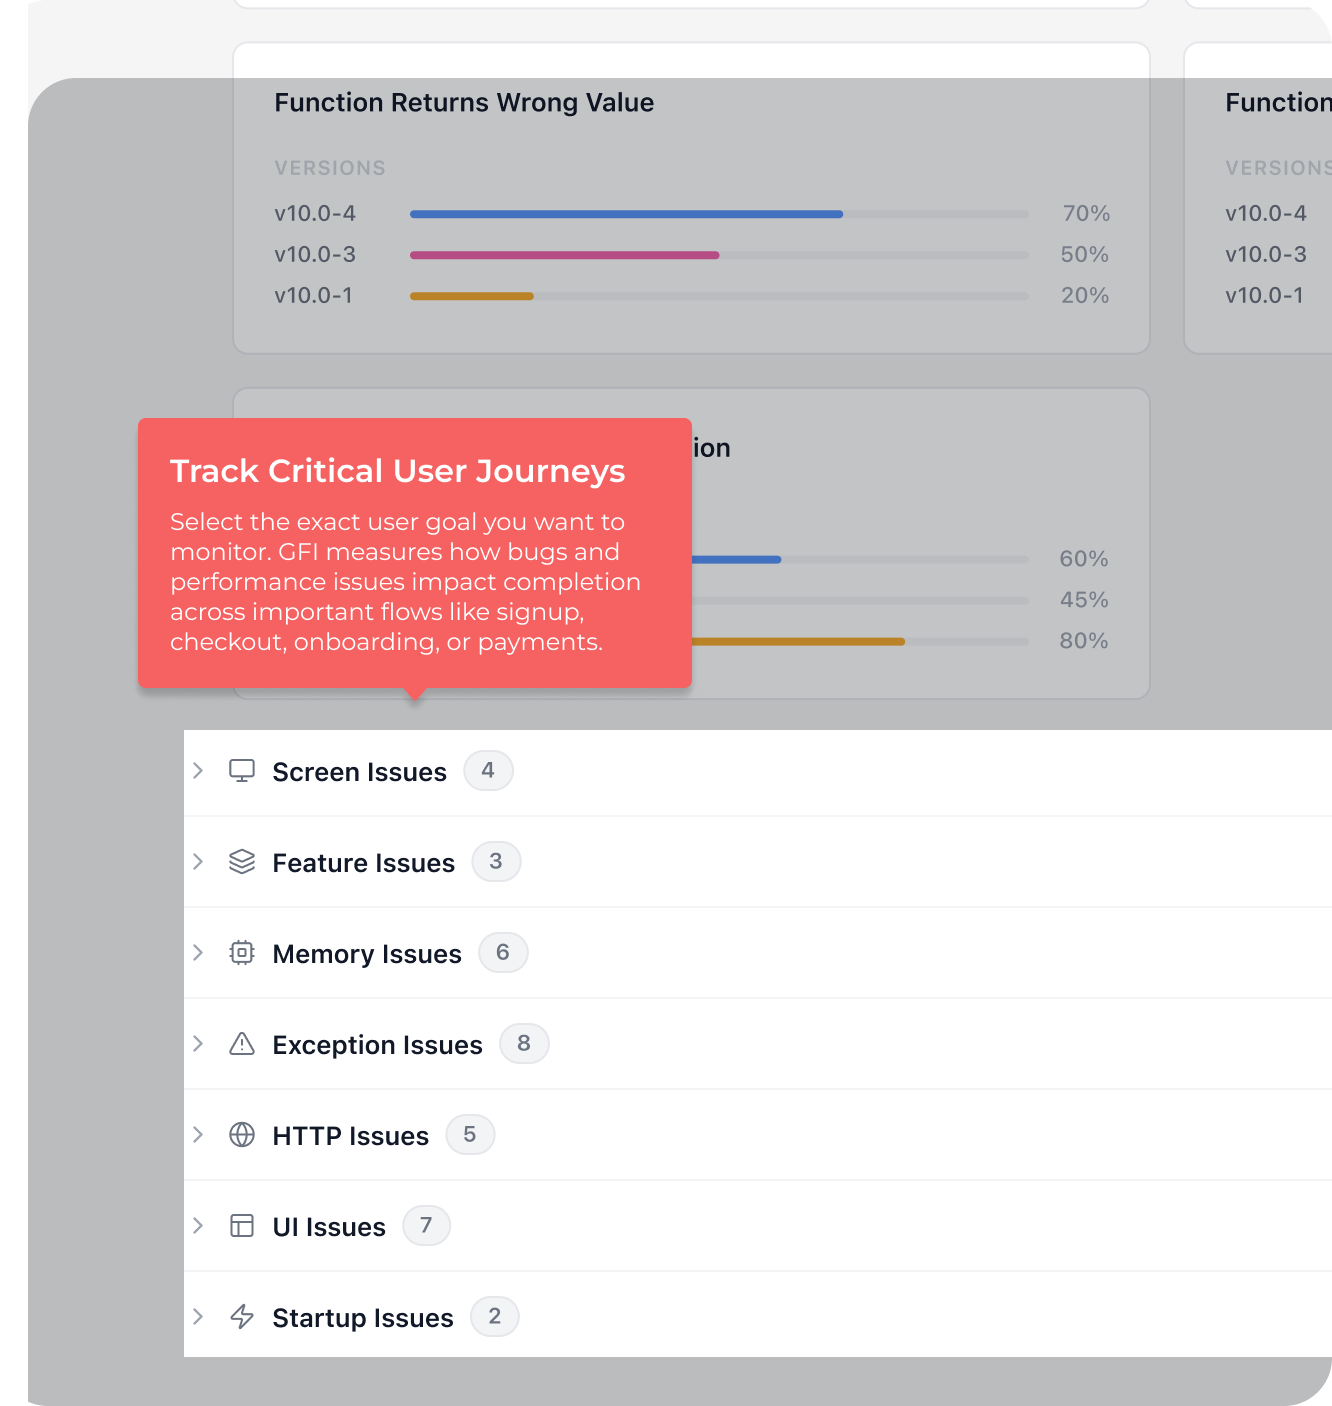
Benchmark Across Versions
Analyze how users interact with every goal by tracking completions, failures, retries, and drop-offs. Discover where friction impacts conversions before it affects business growth.
Frequently asked questions
Frequently asked questions about Goal Friction Impact and how it helps your app succeed.
Appxiom is a mobile-first bug intelligence platform that goes beyond simple crash reporting. Instead of just showing technical logs, it helps teams understand how bugs affect real user journeys, business metrics, and product outcomes. This means you don’t just know what broke—you know what matters most.
Quality Score is a single, normalized metric (scaled 0-10) that represents the overall health and reliability of an app version. It connects crashes, ANRs (App Not Responding), memory leaks, and UI freezes, weighing each by the GFI (Goal Friction Impact) of the user flows they interrupt. A higher score means smoother user experiences and fewer roadblocks.
GFI is our proprietary algorithm that measures how technical issues disrupt critical user journeys (like signing up, completing a checkout, or uploading a file). By calculating user drop-offs and friction rates during these flows, GFI quantifies the exact business impact of every bug, enabling teams to prioritize by revenue and retention.
Integrating Quality Score is extremely simple. Appxiom provides lightweight, low-footprint SDKs for iOS, Android, Flutter, and React Native. You can also connect it to your Jira, Slack, or Microsoft Teams channels to get real-time alerts and auto-create issues whenever a newly released version triggers a Quality Score regression.